Mutual Non-Disclosure Agreement (NDA)
This Mutual Non-Disclosure Agreement (“Agreement”) is entered into as of [Date], by and between:
Party A: [ David Jamison, MMT Media Florida / KOKRadar.xyz a.ka. KOLRadar A.I. ], with a place of business at [Address] (“Disclosing Party A”), and
Party B: [ Developer / Candidate Name ], with a place of business (Company / Person) [ Country ] (“Disclosing Party B”).
Party A and Party B may be referred to collectively as the “Parties” and individually as a “Party.”
1. Purpose
The Parties wish to explore a potential business relationship regarding KOLRadar.xyz (the “Project”), during which each Party may disclose to the other certain confidential and proprietary information. This Agreement is intended to protect such information.
2. Definition of Confidential Information
“Confidential Information” means any non-public, proprietary, or sensitive information disclosed by either Party to the other, whether oral, written, electronic, or in any other form, including but not limited to:
Technical data, trade secrets, software, documentation, business plans, financials, marketing strategies, and product concepts.
Any analyses, compilations, or notes prepared by the receiving Party that contain or reflect such information.
Confidential Information does not include information that:a) is or becomes publicly known through no breach of this Agreement,b) is rightfully received by the receiving Party from a third party without restriction,c) is independently developed by the receiving Party without use of Confidential Information, ord) is approved for release by written consent of the disclosing Party.
3. Obligations of the Parties
Each Party agrees:
To use Confidential Information solely for the purpose of evaluating or engaging in discussions regarding the Project.
To restrict disclosure of Confidential Information to only those employees, contractors, or advisors who have a legitimate need to know and are bound by confidentiality obligations no less restrictive than those herein.
Not to disclose Confidential Information to any third party without prior written consent of the disclosing Party.
To protect Confidential Information with the same degree of care it uses to protect its own sensitive information, but in no event less than reasonable care.
4. Term
This Agreement shall commence on the Effective Date and continue for two (2) years unless terminated earlier by either Party with thirty (30) days’ written notice. The confidentiality obligations hereunder shall survive for three (3) years after termination.
5. No License
Nothing in this Agreement grants either Party any license or rights to the other Party’s intellectual property except as expressly set forth herein.
6. No Obligation to Proceed
Nothing in this Agreement obligates either Party to enter into any further agreement or business relationship. Each Party reserves the right to discontinue discussions at any time.
7. Remedies
The Parties acknowledge that a breach of this Agreement may cause irreparable harm, for which monetary damages may be inadequate. In such case, the disclosing Party shall be entitled to seek injunctive relief in addition to any other remedies available at law or equity.
8. Governing Law
This Agreement shall be governed by and construed in accordance with the laws of the State of [Your State], without regard to conflict of laws principles.
9. Entire Agreement
This Agreement constitutes the entire understanding between the Parties regarding the subject matter hereof and supersedes all prior agreements, whether written or oral.
IN WITNESS WHEREOF, the Parties have executed this Agreement as of the Effective Date.
Party A: MMT Media Florida, CryptoJamz.com / KolRadar.xyz / CryptoInfluencerDirectory.com
Name / Title: David Jamison, Owner / Founder / CEO: MMT Media Florida LLC / CryptoJamz.comDate: August 22, 2025
Party B: KOLRadar.xyz DEVELOPER / PARTNERS Name / Title: TAG: kol_radar_developers "ALL"Date: TAG: acceptance_date "ALL"


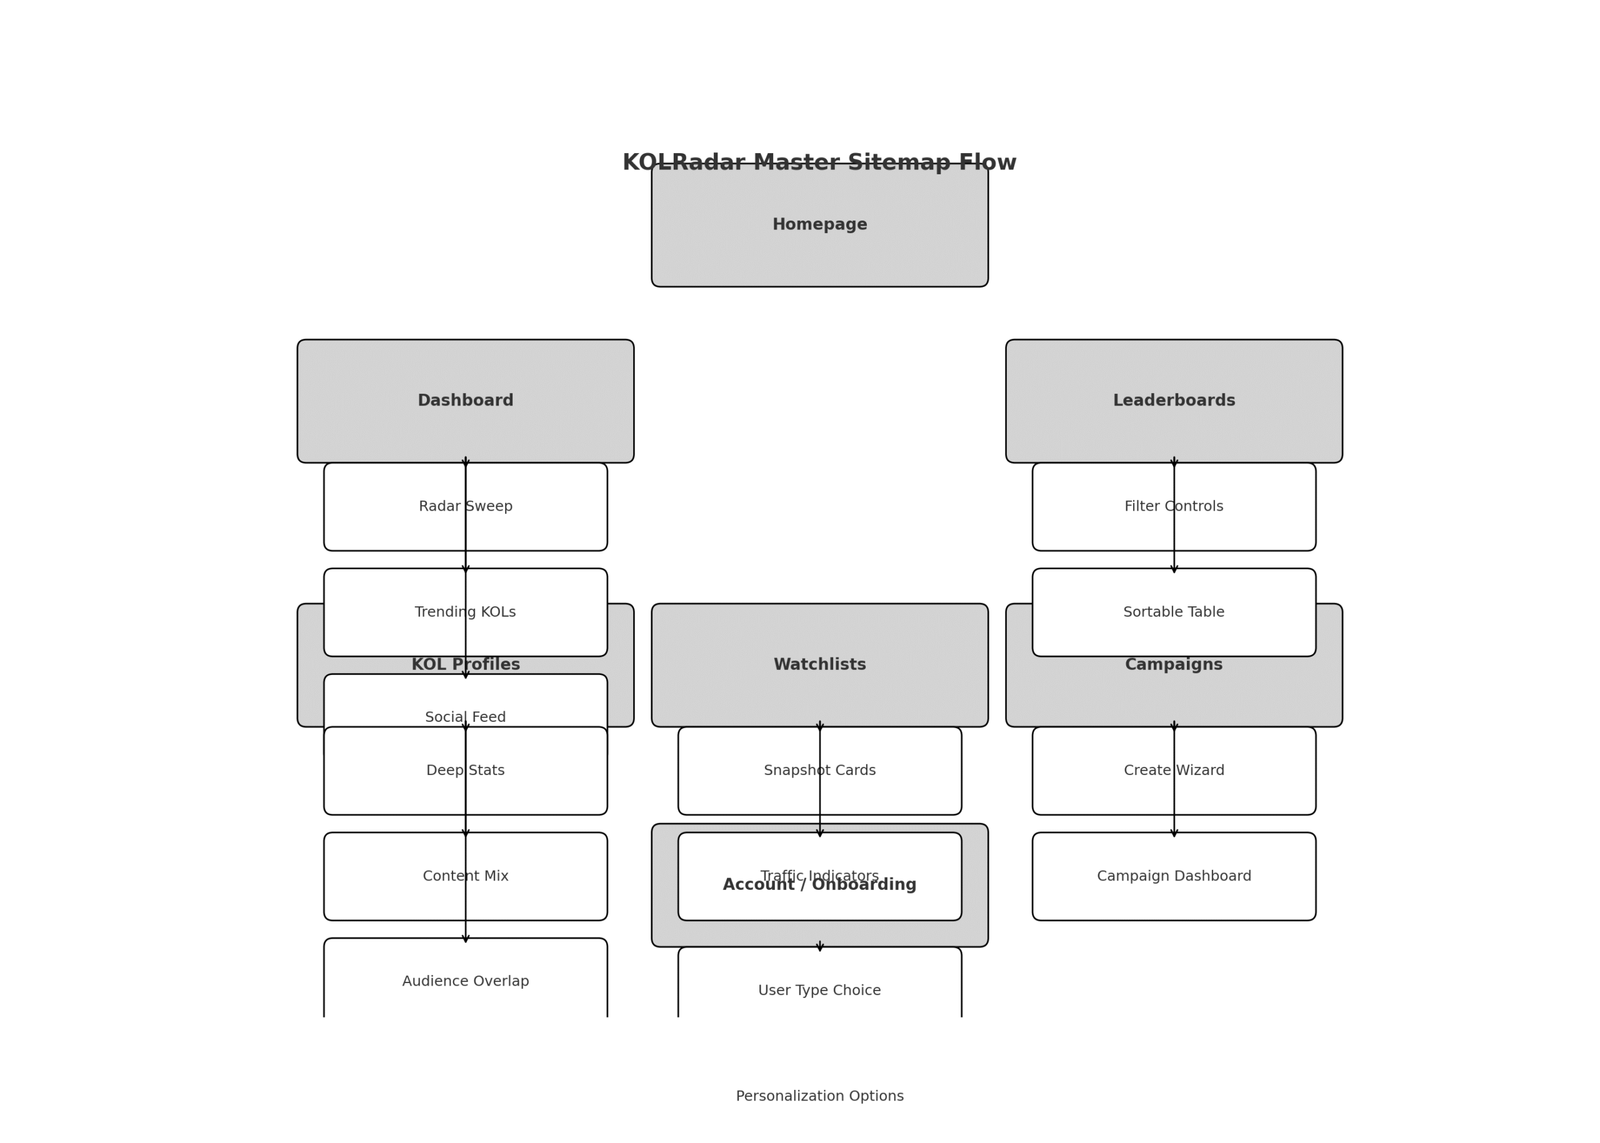
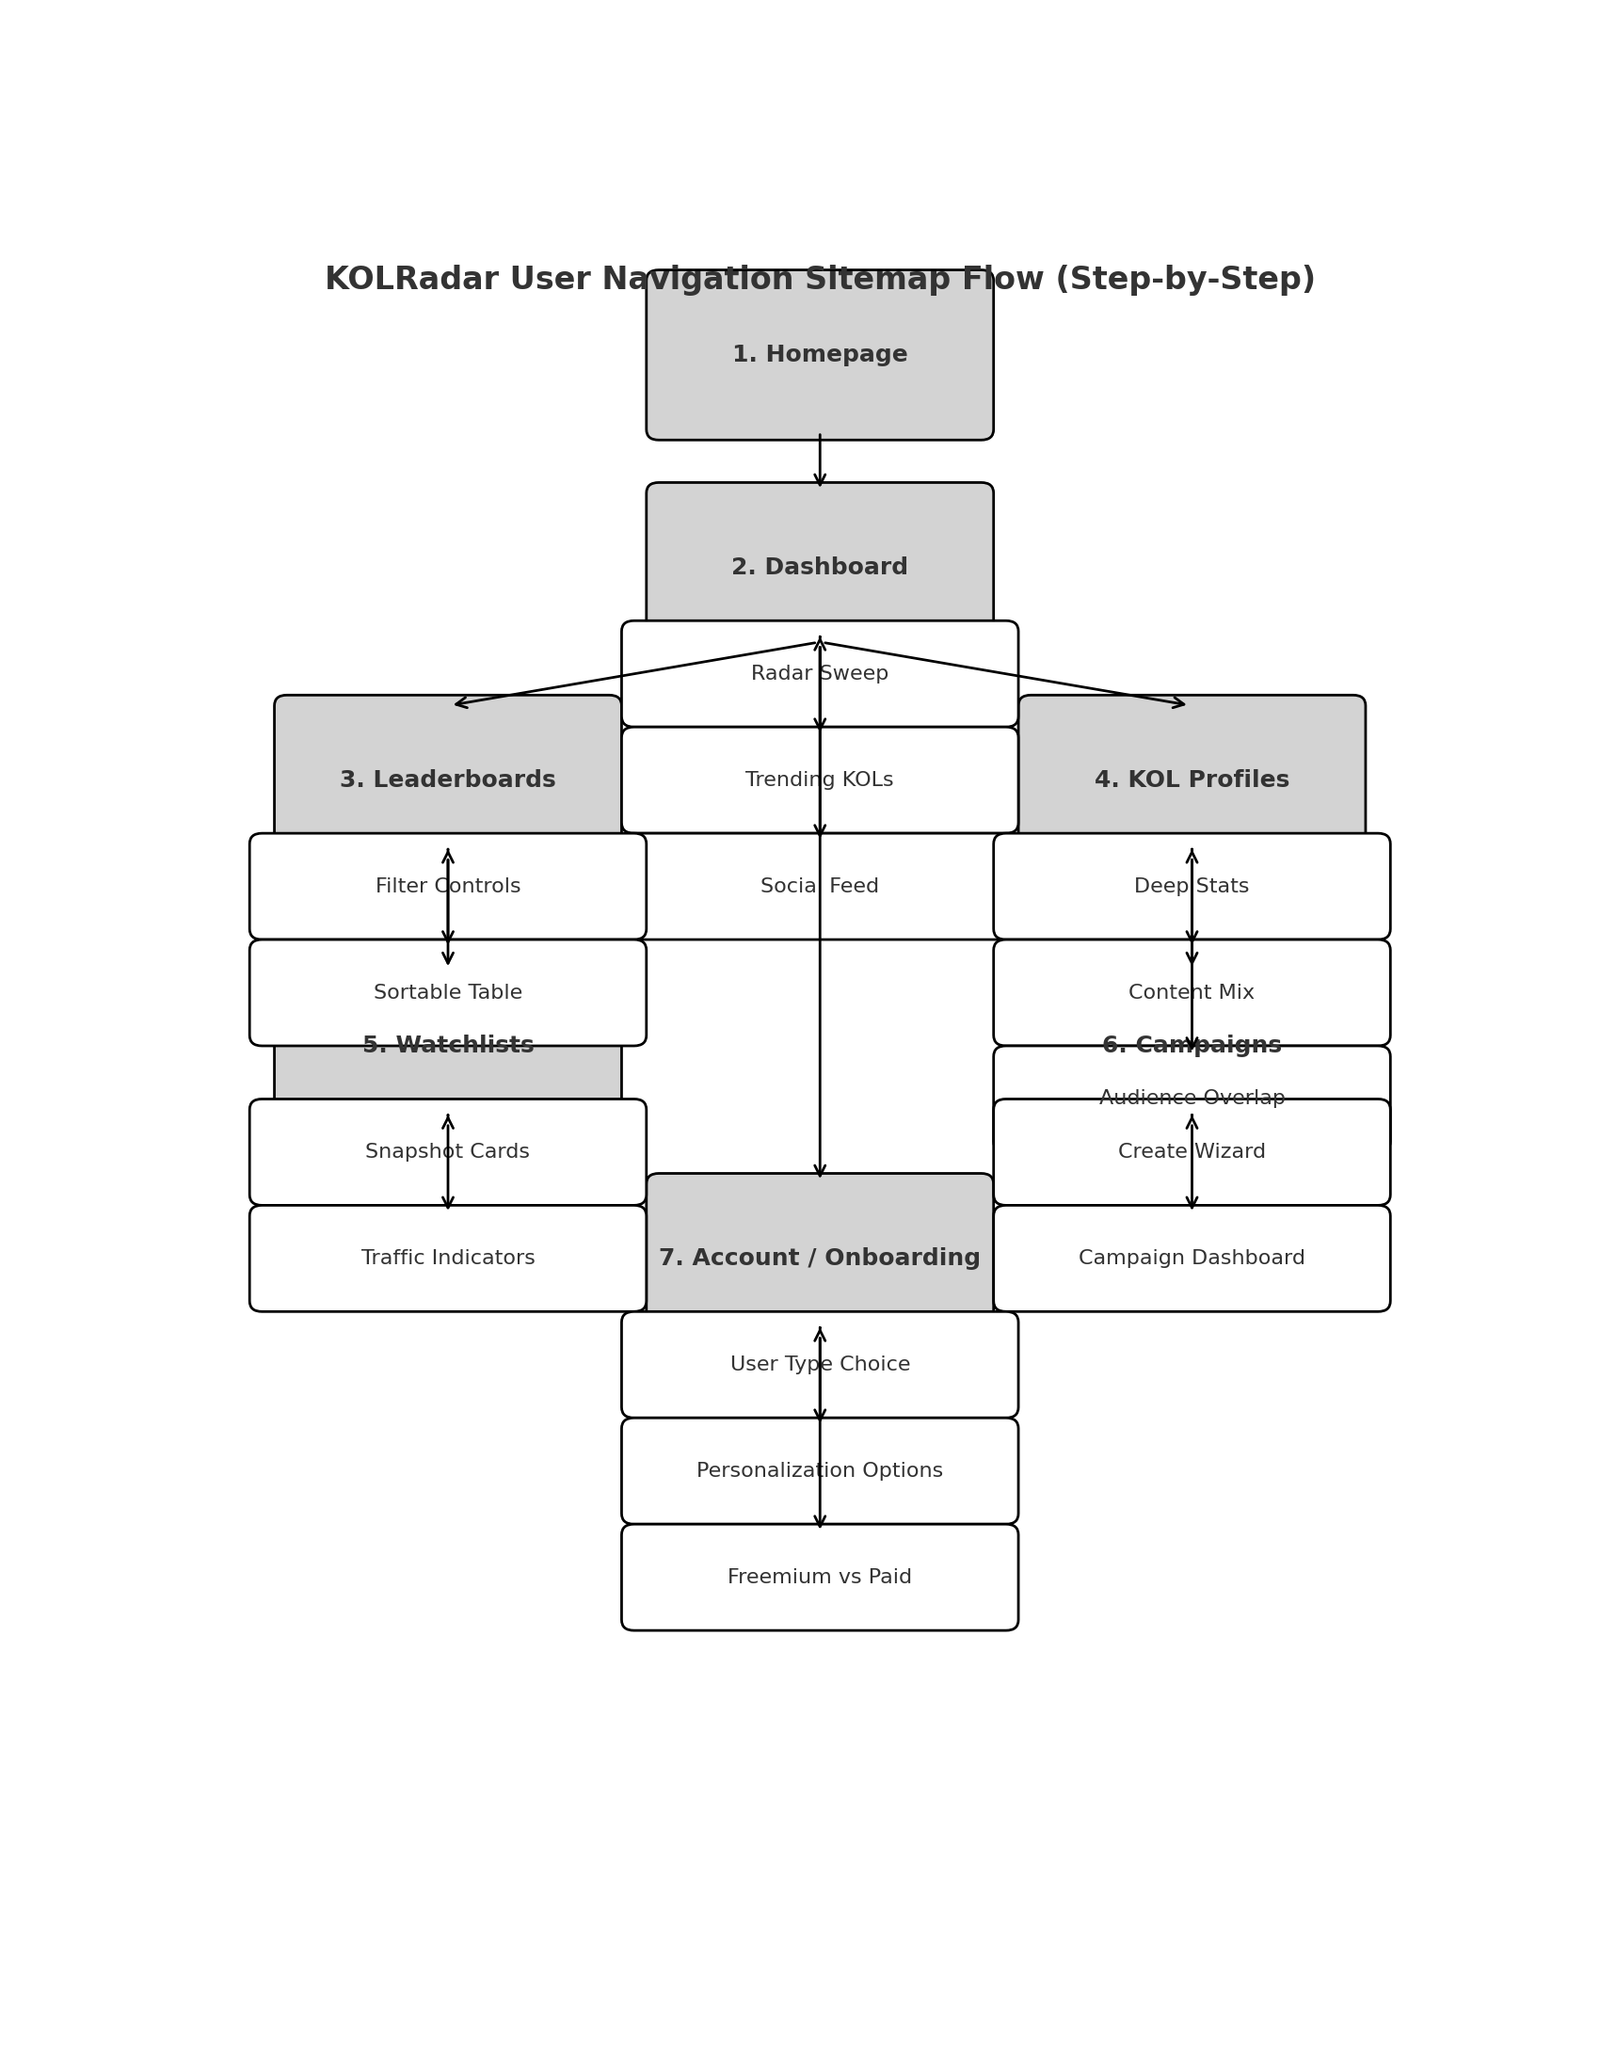
 Mockup Site Structure for DEVELOPER


